What are Style Analytics?
 Polyvore’s Style Analytics provides various data and insights into your brand on Polyvore. You can use these analytics to better understand your customers, potential leads, competitors, which items are most popular, and more.
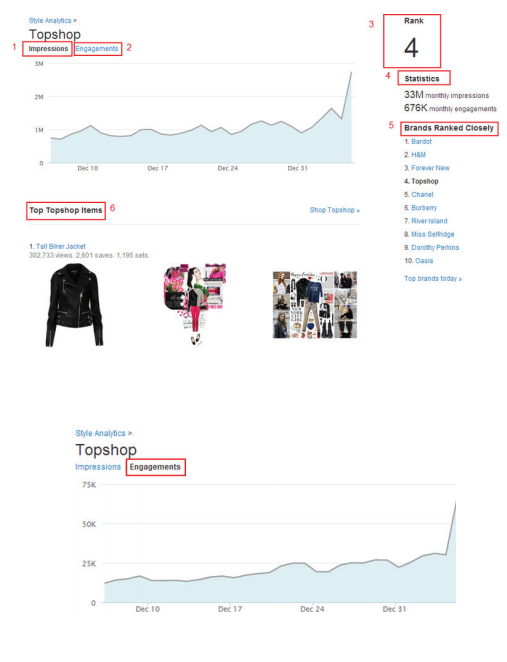
1. Impressions
Are broken down day by day over a period of a month, which calculates how many people view your sets, collections, profile, etc.
2. Engagements
Are broken down in the same way as impressions – day by day over a month’s period. Engagements refer to how many people are interacting with the brand retailer – which includes likes, saves, clips, and more!
3. Rank
Rank is the number that tells you how popular the brand/retailer is. As you can see, Topshop’s rank is 4. Which means Topshop is the 4th most popular brand on Polyvore.
4. Statistics
Rounds up the monthly amount of your Impressions and Engagements. On the graphs, it only says how many per day. The statistics adds up them up into monthly periods.
5. Brands Ranked Closely
This is a cool feature that allows you to view brands that have similar impressions and engagements. It may open your eyes to some new competition!
6. Top Items
Shows you which of your items on Polyvore arethe most popular at the moment. It includes which ones have the most views, saves and sets.
Check Out “Polyvore Guide for Retailers & Brands: The Clipper Tool”
Polyvore’s Style Analytics provides various data and insights into your brand on Polyvore. You can use these analytics to better understand your customers, potential leads, competitors, which items are most popular, and more.
1. Impressions
Are broken down day by day over a period of a month, which calculates how many people view your sets, collections, profile, etc.
2. Engagements
Are broken down in the same way as impressions – day by day over a month’s period. Engagements refer to how many people are interacting with the brand retailer – which includes likes, saves, clips, and more!
3. Rank
Rank is the number that tells you how popular the brand/retailer is. As you can see, Topshop’s rank is 4. Which means Topshop is the 4th most popular brand on Polyvore.
4. Statistics
Rounds up the monthly amount of your Impressions and Engagements. On the graphs, it only says how many per day. The statistics adds up them up into monthly periods.
5. Brands Ranked Closely
This is a cool feature that allows you to view brands that have similar impressions and engagements. It may open your eyes to some new competition!
6. Top Items
Shows you which of your items on Polyvore arethe most popular at the moment. It includes which ones have the most views, saves and sets.
Check Out “Polyvore Guide for Retailers & Brands: The Clipper Tool”